Fragmentation Exposure Scorecard Calculator
This calculator assesses your company's fragmentation exposure based on five key metrics from the article. Enter your company's data and receive a risk score with actionable recommendations.
Percentage of critical inputs from regions under sanctions, export controls, or political tension (e.g., China, Taiwan, Russia)
Percentage of revenue from outside your home country (e.g., U.S.-based companies: % revenue from outside North America)
Number of different regulatory frameworks you must follow across regions
Number of critical technology dependencies vulnerable to sanctions or supply chain disruptions
Percentage of your investment portfolio in U.S. equities
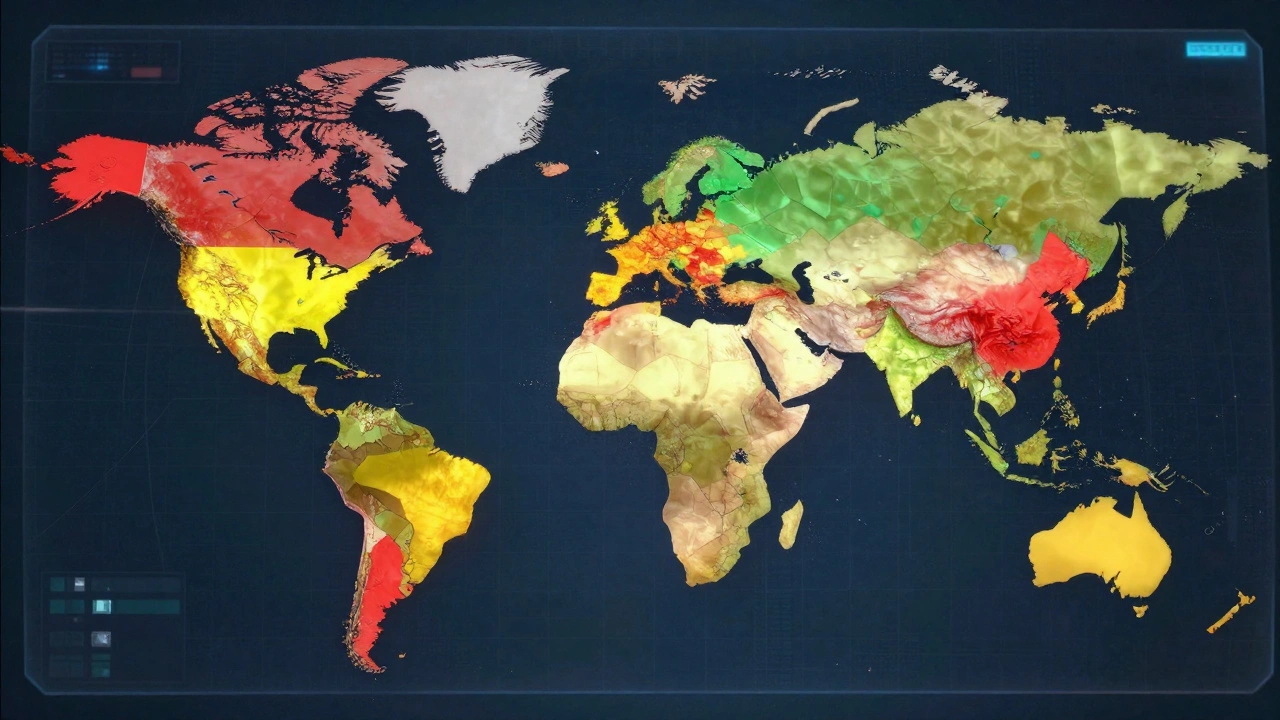
By 2025, global companies aren’t just managing risks-they’re managing fragmentation. What used to be called globalization is now a patchwork of competing economic blocs, conflicting regulations, and supply chains that no longer follow the shortest path. If your company still treats international operations like a single, seamless network, you’re already behind.
What Fragmentation Exposure Really Means
Fragmentation exposure isn’t about one bad headline or a single tariff hike. It’s the cumulative impact of policy choices that are pulling the global economy apart. Think of it like a spiderweb stretched too thin: when one thread snaps, others start to unravel. The World Economic Forum estimates this could cost the global economy between $600 billion and $5.7 trillion in lost output over the next year alone. That’s not a hypothetical-it’s happening now. Companies are feeling it in three places: their supply chains, their revenue streams, and their balance sheets. A manufacturer in Germany might find its microchips blocked by U.S. export controls. A retailer in Brazil could see its profits wiped out by currency swings caused by U.S. interest rate policy. A tech firm in China might watch its valuation crash because foreign investors are pulling out of markets they now see as politically risky.The Five Core Metrics That Matter
To survive, you need a scorecard. Not a vague checklist. A real, data-driven measurement system. Here are the five metrics that actually move the needle:- Supply Chain Geography: What percentage of your critical inputs come from regions under sanctions, export controls, or political tension? If more than 20% of your components come from China, Taiwan, or Russia, you’re exposed. Companies that moved to "just-in-case" inventory models in 2024 saw a 15-30% increase in carrying costs-but they also avoided shutdowns when ports closed or shipments were seized.
- Revenue Geography: Where does your money come from? FactSet found that U.S.-based multinationals with over 40% of revenue from outside North America saw their stock valuations drop twice as fast during dollar surges as those with domestic-heavy sales. If your growth is tied to Europe, Southeast Asia, or Latin America, you’re not just exposed to economic cycles-you’re exposed to policy shocks.
- Regulatory Complexity: How many different rulebooks do you have to follow? The PwC 2025 Global Treasury Survey found that only 36% of companies use automated tools to track cross-border compliance. If you’re manually managing tax rules in five countries, you’re not just wasting time-you’re risking fines, delays, and missed opportunities.
- Technology Dependencies: Are you using cloud services, software, or hardware from vendors that could be sanctioned? A single reliance on U.S.-based AI chips or Chinese 5G infrastructure can become a fatal vulnerability. Companies that mapped their tech stack by geopolitical risk in 2024 reduced supply chain disruption risk by 41% within a year.
- Valuation Sensitivity: How much of your company’s worth depends on the myth of U.S. exceptionalism? Allianz’s research shows that U.S. tech stocks were trading at 35x earnings in 2025-while their Chinese counterparts were at 69x. That gap isn’t about performance. It’s about belief. If investors stop believing in the U.S. as the safe haven, those valuations collapse.
Why Your Financial Strategy Is Out of Date
Most corporate treasuries still operate like it’s 2019. They assume liquidity flows freely, currencies behave predictably, and capital markets remain interconnected. That’s not true anymore. The BIS (Bank for International Settlements) reported in early 2025 that fragmentation has killed the "soft landing" scenario. Instead of a gentle slowdown, we’re seeing synchronized shocks: inflation spikes in Europe, credit tightening in Asia, capital flight from emerging markets. And companies without a fragmentation scorecard are flying blind. Consider this: a company with 66% of its portfolio in U.S. equities-once considered "conservative"-is now overexposed. Allianz’s research shows that capping U.S. exposure at 54% and increasing allocations to Europe and Asia improves portfolio resilience. Why? Because when U.S. policy shifts, global markets don’t move together anymore. A drop in U.S. tech stocks doesn’t mean global markets fall. It means European and Asian firms gain relative strength.
Who’s Getting It Right
Fidelity’s 2025 analysis of ETF strategies revealed something surprising: the best-performing funds weren’t those that avoided risk. They were the ones that measured it. One fund, for example, used geographic revenue segmentation to avoid overexposure to China’s semiconductor sector while increasing weight in Indian and Vietnamese manufacturers. Another adjusted its currency hedges based on real-time regulatory news feeds-not quarterly reports. Companies like Siemens, Unilever, and Toyota have built internal fragmentation dashboards. They track:- Which suppliers are in sanctioned zones
- Which customers are in regions with currency controls
- Which R&D partners rely on U.S. or Chinese IP
- Which financing sources are tied to volatile capital markets
The Hidden Cost: Inflation and Liquidity
Fragmentation doesn’t just break supply chains-it breaks price stability. The WEF found that every 10% increase in trade fragmentation leads to a 0.8% rise in inflation across major economies. Why? Because when you can’t source efficiently, you pay more. When you can’t hedge currency risk, you pass costs to customers. When you can’t access global capital, you borrow at higher rates. Liquidity is vanishing too. In 2024, corporate bond markets in emerging economies saw trading volumes drop by 38% as foreign investors pulled out. Companies that relied on offshore financing are now scrambling. Those with diversified funding sources-local banks, regional bond issuances, multilateral loans-are surviving. The rest are cutting R&D, delaying expansion, or selling assets at fire-sale prices.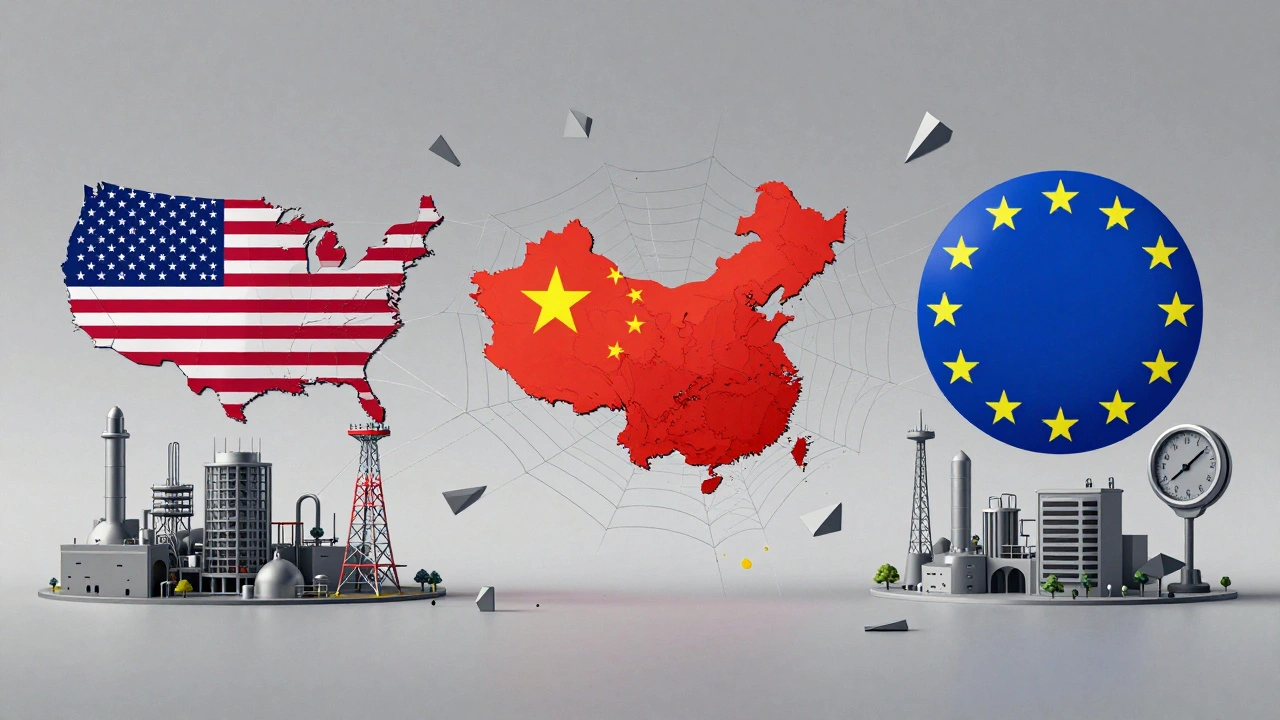
What to Do Now
If you haven’t started, you’re already late. But it’s not too late to act. Here’s your 90-day plan:- Map your exposure: List every critical input, revenue stream, technology, and financing source. Tag each with its geopolitical risk level (low, medium, high).
- Build a dashboard: Use existing ERP or treasury tools to track changes. You don’t need AI. You need data. Start with revenue by country, supplier locations, and compliance burden.
- Test scenarios: Run three stress tests. What happens if the U.S. bans AI exports? What if the EU imposes a digital tax on U.S. tech? What if China restricts rare earth exports?
- Adjust your portfolio: If you’re over 54% in U.S. equities, reduce. If you’re under 20% in Asia and Europe, increase. Diversification isn’t about geography-it’s about risk independence.
- Train your team: Finance, legal, procurement, and strategy teams need to speak the same language. Fragmentation isn’t a CFO issue. It’s a CEO issue.
It’s Not a Cycle. It’s a New System.
This isn’t a temporary bump. The global economy isn’t going back to the way it was. The U.S., China, and the EU are building parallel systems-with different rules, currencies, technologies, and alliances. Companies that treat this as a short-term disruption will fail. Those that treat it as the new normal will thrive. The scorecard isn’t optional. It’s your survival tool. If you don’t measure it, you can’t manage it. And if you can’t manage it, you’ll be the next casualty.What’s the difference between fragmentation exposure and general geopolitical risk?
Geopolitical risk is broad-it includes wars, coups, or elections. Fragmentation exposure is specific: it’s about how policy decisions-like tariffs, export bans, or subsidies-create lasting, structural splits in global trade, finance, and technology. It’s not about whether a country is stable. It’s about whether your supply chain, revenue, or funding source is now trapped in a separate economic bloc.
Can small companies afford to build a fragmentation scorecard?
Yes-and they need to more than large firms. Large companies have teams and budgets. Small firms don’t. But they’re also more vulnerable. A single supplier cutoff or payment delay can kill them. Start simple: track your top five suppliers, top three revenue markets, and main financing source. Use free tools like the World Bank’s trade data portal or OECD policy trackers. You don’t need AI. You need awareness.
Why is U.S. equity exposure above 54% risky now?
Because the U.S. market isn’t the global economy anymore. It’s 65% of global market cap, but only 20% of global GDP. That mismatch means U.S. valuations rely on investor belief, not fundamentals. When fragmentation increases, foreign investors pull out. Domestic U.S. firms may do fine-but tech giants tied to global supply chains? They’re exposed. Allianz’s data shows portfolios capped at 54% U.S. exposure had 32% lower drawdowns during 2024-2025 volatility spikes.
Which industries are most at risk?
Semiconductors, energy, financial services, cloud infrastructure, and advanced manufacturing. Why? Because they’re the targets of national industrial policies: the U.S. Inflation Reduction Act, China’s Made in China 2025, and the EU Chips Act. These aren’t market-driven shifts-they’re government-driven rewrites of global supply chains. Companies in these sectors are seeing production lines split, R&D partnerships broken, and customer bases divided overnight.
Is there a tool I can use to build my own scorecard?
There isn’t one perfect tool yet-but you can build one. Start with Excel or Google Sheets. Create columns for: supplier location, revenue by country, regulatory jurisdictions, tech dependencies, and funding sources. Then add color codes: green (low risk), yellow (medium), red (high). Update it monthly. The goal isn’t perfection. It’s visibility. Companies that did this in 2024 cut supply chain disruptions by 45% in 2025.