FDI vs. Portfolio Investment Impact Calculator
Compare how Foreign Direct Investment (FDI) and portfolio investments react during geopolitical crises. Based on IMF data showing FDI is 47% less volatile than portfolio flows during market shocks.
Investment Parameters
Investment Impact Analysis
FDI Volatility:
Portfolio Volatility:
FDI is 47% less volatile than portfolio flows during geopolitical shocks. Example: During 2020 market crash, portfolio flows fell 38.7% while FDI dropped only 12.3%.
Expected FDI Loss
$0
Expected Portfolio Loss
$0
Cost of Capital Increase
0.00%
Based on IMF data: Fragmentation raises capital costs for emerging markets by 150-200 basis points (1.5-2.0%).
Money doesn’t just sit still. It moves-across borders, between markets, through banks and hedge funds and sovereign wealth funds. In 2022, $11.3 trillion crossed international borders. That’s more than the entire GDP of Japan. But today, that flow isn’t smooth. It’s fractured. And the way capital moves now tells us more about the world’s future than any political speech or trade deal ever could.
What’s Really Moving? FDI vs. Portfolio Investment
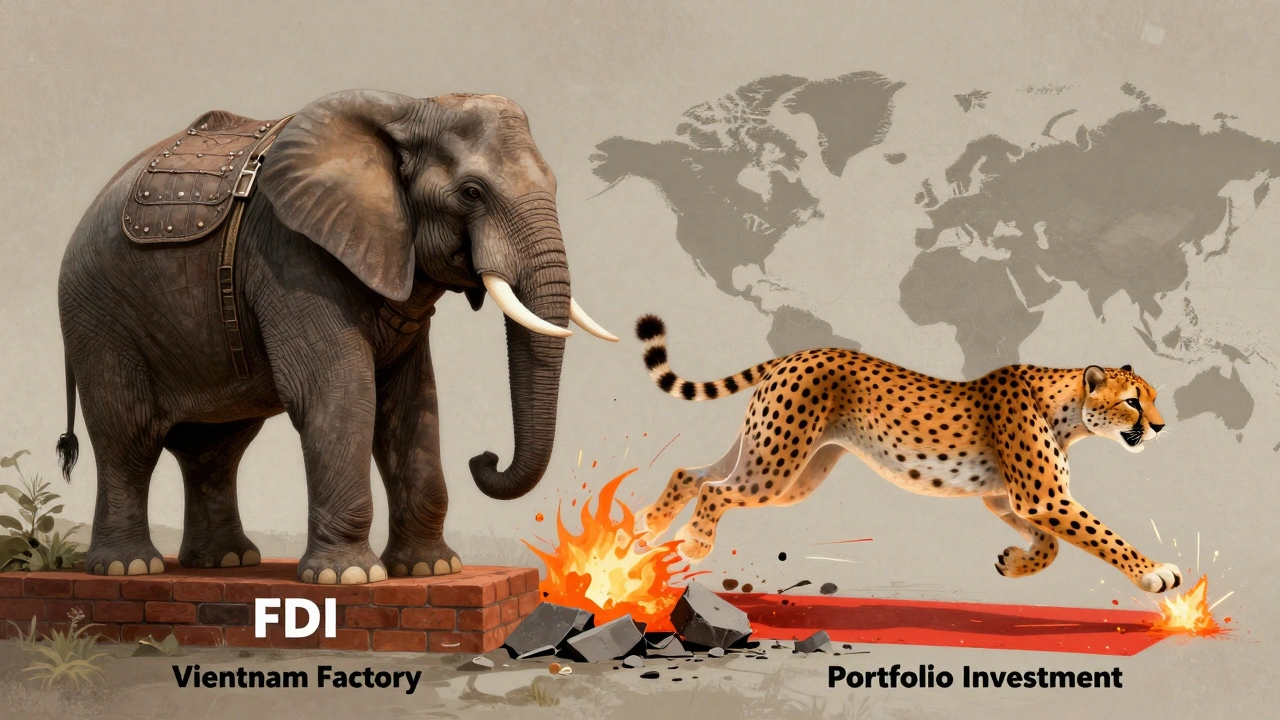
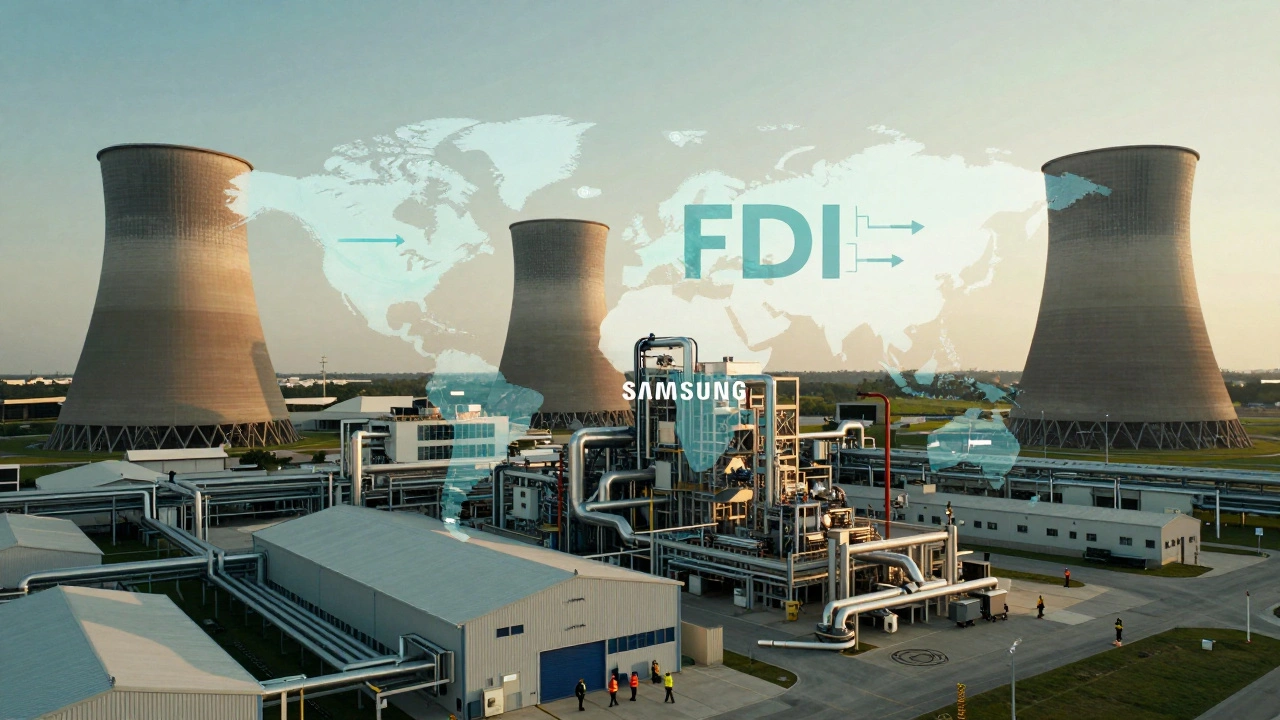
Not all cross-border money is the same. There are two main players: Foreign Direct Investment (FDI) and portfolio investment. They behave like different animals in the same forest. FDI is the slow, heavy one. It’s when a company builds a factory overseas, buys a plant, or takes a controlling stake-usually 10% or more in a foreign business. The average FDI project costs $28.7 million. It’s not about flipping assets. It’s about staying. The Samsung semiconductor plant in Texas? That’s FDI. It’s locked in for decades. It brings jobs, tech, and supply chains. When companies reshore production, FDI is what moves. Portfolio investment? That’s the sprinter. It’s buying foreign stocks, bonds, or ETFs without any control. You own shares in a German auto maker or a Brazilian bond fund. You don’t run it. You just hold it. And you can sell it in minutes. The average holding period? Just 11.3 months. During the March 2020 market crash, investors pulled $187 billion out of emerging market bond funds in under 72 hours. That’s portfolio investment in action-fluid, fast, and fragile. Then there’s “other investment”-loans, currency deposits, trade credit. It’s the most volatile. Often lasts less than six months. And it’s the first to vanish when things get shaky.The Fragmentation Effect: Regional Blocs Are Replacing Global Networks
Ten years ago, capital flowed freely from the U.S. to China, from Europe to India, from Japan to Brazil. Now? The map is being redrawn. Between 2021 and 2023, FDI from China to Europe dropped 22%. U.S.-China venture capital deals fell 37%. Meanwhile, capital moving within regional blocs-like within the EU, ASEAN, or North America-jumped 18.5%. Why? Because trust is breaking down. Sanctions. Export controls. Tech bans. National security reviews. The U.S. now blocks FDI in 78% of cases targeting semiconductors, AI, and clean energy. The EU’s Critical Raw Materials Act, launched in January 2025, redirected €18.7 billion in FDI to domestic processing facilities-cutting imports from outside the bloc by 23%. This isn’t just about politics. It’s economics. The IMF found that fragmentation is raising the cost of capital for emerging markets by 150-200 basis points. A country that used to pay 5.2% to borrow money now pays 8.7%. That’s a massive tax on growth.Why FDI Holds Up Better Than Portfolio Flows
When the Ukraine war started in 2022, portfolio flows to emerging markets plunged. But FDI? It held steady. Why? Because FDI is real. It’s bricks, machines, factories, and people on the ground. You can’t just walk away from a plant in Vietnam or a refinery in Mexico. Portfolio investors? They can click “sell” and be gone before breakfast. Research shows FDI is 47% less volatile than portfolio flows during geopolitical shocks. During the 2014-2016 Russia sanctions, FDI fell by 12.3%. Portfolio flows? Down 38.7%. The same pattern repeated in 2020 and 2022. But FDI isn’t perfect. It’s slower to adapt. And it’s getting harder to get. Since 2019, 68 countries have added new investment screening rules. Forty-three percent of them target tech. The U.S. Department of Commerce saw a 44% jump in FDI investigations in Q1 2025. Most of those were in chips, biotech, and green energy.