
Liquidity Fragmentation Cost Calculator
How Liquidity Fragmentation Affects Your Trades
This calculator shows how liquidity fragmentation can increase your trading costs beyond what you see on your screen. The effective spread you pay is often significantly higher than the quoted spread due to fragmented liquidity across multiple venues.
Key Insight: The article explains that liquidity fragmentation creates an "invisible tax" on every trade. In crypto markets, this can add 0.5% to 1.5% in hidden costs compared to the quoted spread you see.
Your Trade Analysis
Based on your inputs, liquidity fragmentation is significantly increasing your effective trading cost.
Trade Breakdown
Quoted Spread
0.00%
Effective Spread
0.00%
Hidden Cost Amount
Percentage Increase
0%
What this means: Your effective cost is 0.00% higher than the quoted spread. For a $10,000 trade, this translates to $0.00 in additional fees due to liquidity fragmentation.
Pro Tip: In fragmented markets like crypto, always check multiple venues. A 0.5% price difference across exchanges can save you hundreds of dollars on large trades.
When you buy a stock or a cryptocurrency, you assume the price you see is the price you get. But in today’s markets, that’s rarely true. Liquidity isn’t sitting in one place anymore-it’s scattered across dozens of exchanges, dark pools, and blockchain networks. This fragmentation isn’t a bug; it’s the new reality. And if you’re trading without understanding how it works, you’re paying more, getting worse fills, and taking risks you don’t even see.
Why Liquidity Is Everywhere and Nowhere
A decade ago, most trading happened on a few major exchanges. Today, a single asset like Bitcoin trades on over 50 centralized exchanges and hundreds of decentralized ones. USDC moves across 15+ blockchains, each with its own set of liquidity pools. In traditional markets, the U.S. has 13 registered national exchanges-up from just five in 2005. Europe has over 20 multilateral trading facilities under MiFID II. This isn’t chaos-it’s competition. But competition doesn’t always mean better prices. It means liquidity fragmentation. When liquidity is spread thin across venues, the depth you see on one exchange might not exist on another. A $10 million order on Binance might get filled cleanly, but the same order on Kraken could trigger a 2% price move. Why? Because the order book is shallow. The same asset, same moment, different prices. This is called price dispersion. And it’s not a glitch-it’s structural.How Market-Makers Survive in a Fractured World
Market-makers used to just quote bid and ask prices on one exchange. Now, they’re running multi-venue operations like hedge funds. They don’t just wait for orders-they hunt for liquidity. And they do it with algorithms that scan 20+ venues in milliseconds. These systems don’t just look at price. They measure depth, slippage, settlement risk, and even API latency. A trade might look cheaper on Exchange A, but if the order book is thin and the API drops packets 15% of the time, it’s a trap. Market-makers avoid these traps by weighting each venue by execution probability, not just spread. In crypto, where settlement can take seconds on one chain and minutes on another, timing matters more than price. A market-maker might pass on a 0.02% better rate on Solana if the underlying blockchain is congested and finality is uncertain. They’re not chasing pennies-they’re managing risk across a dozen moving parts.Spreads Are Wider Than You Think
You’ve seen the bid-ask spread on your trading platform. Maybe it’s 0.01% on BTC/USD. Looks tight, right? But that’s the quoted spread on one venue. The effective spread-the real cost of your trade-is often much higher. In traditional markets, spreads are fractions of a basis point. In crypto, they’re 0.1% to 0.5% on average, and spike to over 2% during volatility. Why? Thin order books. When liquidity is fragmented, no single venue has enough depth to absorb large trades without moving the price. So market-makers widen spreads to protect themselves from adverse selection-traders who know something they don’t. And it’s not just crypto. Even in equities, fragmentation increases spreads. Research from SSRN shows that a 1 standard deviation increase in market fragmentation correlates with 80% more price jumps in S&P 500 stocks. Every time a trade hits a thin book, the price snaps. Market-makers compensate by charging more.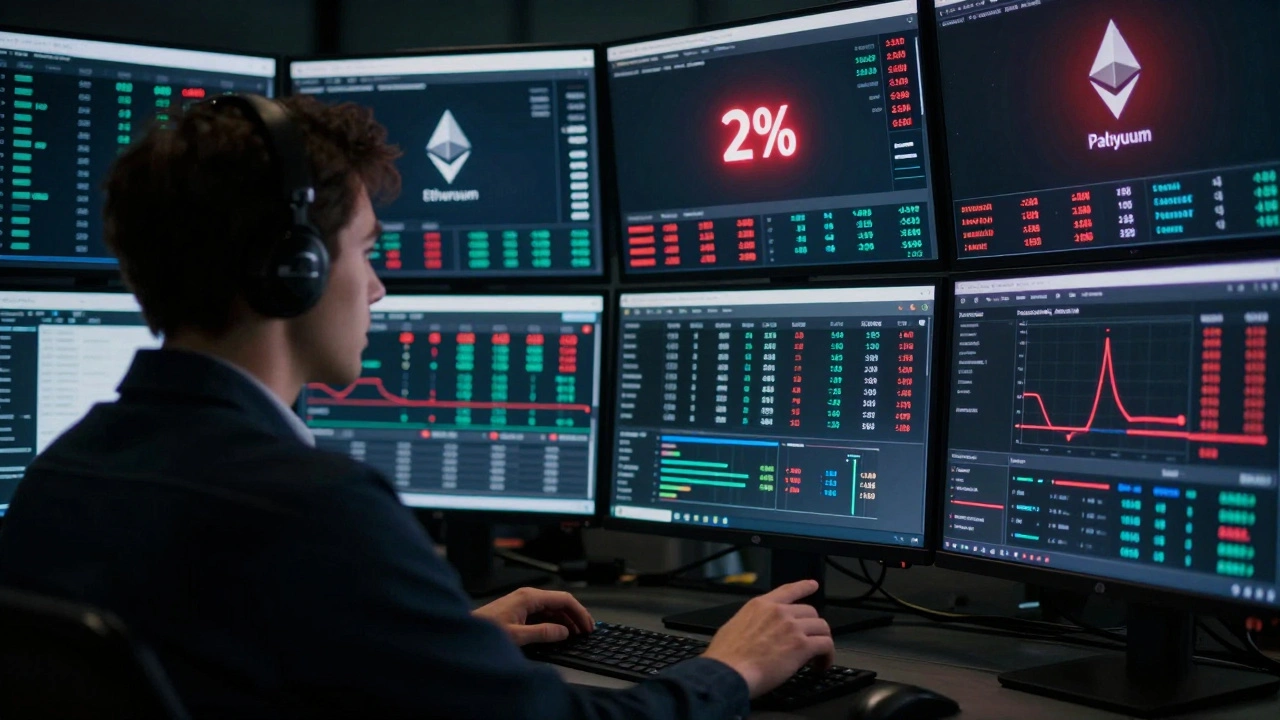
Stress Testing: What Happens When Everything Breaks
Most stress tests assume markets are orderly. They’re not. In 2022, when Terra/Luna collapsed, liquidity vanished across exchanges. Some platforms froze withdrawals. Others saw spreads explode to 15%. Traders who relied on one exchange got trapped. Others who used smart order routing could still trade-but only if they had built resilience into their systems. Effective stress testing for fragmented markets doesn’t just ask, “What if the market drops 20%?” It asks:- What if three major DEXs go offline at once?
- What if Binance’s API slows to 50% capacity during a flash crash?
- What if Ethereum gas fees spike and settlement delays cause 10% of trades to fail?
The Hidden Cost: An Invisible Tax on Every Trade
Fragmentation doesn’t just raise spreads-it creates an invisible tax. Every time you trade, you’re paying for the inefficiency of scattered liquidity. You’re paying for the latency between venues. You’re paying for the risk that your order gets routed to a thin book. Crypto markets are the worst offenders. USDC on Ethereum, Polygon, and Solana isn’t one market-it’s three separate ones. Arbitrage bots close the gaps, but they’re slow. During volatility, price differences of 1-3% can last for minutes. Retail traders don’t see this. They just see “BTC at $62,000” and buy. But if they’d checked three exchanges, they might’ve saved 1.5%. Institutional traders call this the “fragmentation tax.” It’s not a fee. It’s a cost baked into every trade. And it’s growing. Kaiko found that 78% of institutional crypto traders now use liquidity aggregation tools-up from 42% in 2021. They’re not doing it because they want to. They’re doing it because they have to.
Tools That Actually Work
You don’t need to build your own trading engine. But you do need the right tools. - Smart order routing (SOR): Systems like those from LSEG or Kaiko evaluate price, depth, and execution likelihood across venues in real time. They don’t just pick the cheapest-they pick the most reliable. - Liquidity mapping: New tools visualize where liquidity is concentrated. One trader found that 80% of BTC volume on Deribit was hidden in just three order levels. That changed how they sized orders. - API abstraction layers: Instead of coding for 15 different exchange APIs, firms build middleware that normalizes data formats, rate limits, and error codes. One firm cut cross-venue execution time by 40% using this approach. - AI-driven liquidity prediction: LSEG rolled out machine learning in late 2025 to predict where liquidity will move 30-60 seconds ahead. It’s not magic-it’s pattern recognition. If volume spikes on Coinbase, it often drains from Kraken. The system learns that.Who Can’t Afford to Ignore This?
Retail traders? You’re not alone. If you’re using a simple app to trade crypto, you’re likely paying 0.5% more than you should. You’re not being scammed-you’re being fragmented. Institutional traders? If you’re still routing orders manually or relying on one exchange’s data feed, you’re exposing your fund to avoidable slippage. A 0.3% slippage on a $100 million trade is $300,000. That’s not noise-that’s a budget line. Market-makers? If your algorithm doesn’t account for settlement risk, API latency, or venue-specific volatility, you’re not making money-you’re gambling.The Future Won’t Fix This-It Will Just Get Worse
Regulators can’t fix fragmentation. Regulation NMS tried in equities. It helped, but didn’t stop it. Crypto has no global regulator. Blockchain interoperability is making fragmentation worse-not better. New chains launch. New DEXs pop up. Liquidity gets split again. J.P. Morgan predicts crypto fragmentation will grow 15-20% annually through 2027. The solution isn’t centralization. It’s adaptation. The winners won’t be the ones who wish fragmentation away. They’ll be the ones who build systems to navigate it. You don’t need to be a quant. But you do need to understand that liquidity isn’t a number on your screen. It’s a network. And if you don’t map the network, you’ll keep paying for the blind spots.What is liquidity fragmentation in financial markets?
Liquidity fragmentation occurs when trading activity for a single asset is spread across multiple venues-like exchanges, dark pools, or decentralized protocols-instead of being concentrated in one place. This makes it harder to find deep, reliable liquidity, leading to wider spreads, price discrepancies, and execution delays. It’s common in both traditional markets (due to Regulation NMS) and crypto markets (due to multiple blockchains and DEXs).
Why do bid-ask spreads widen in fragmented markets?
Spreads widen because no single venue holds enough order book depth to absorb large trades without moving the price. Market-makers respond by increasing their spread to protect against adverse selection-traders who have better information. In crypto, thin order books across dozens of exchanges can cause spreads to jump from 0.01% to over 2% during volatility.
How do market-makers manage risk across fragmented venues?
They use smart order routing systems that don’t just chase the best price. These systems evaluate depth, execution probability, API reliability, settlement risk, and latency across multiple venues. In crypto, they also account for blockchain-specific delays and finality differences. Many build abstraction layers to normalize data from inconsistent APIs, reducing execution errors by 35-50%.
What’s the difference between traditional and crypto market fragmentation?
Traditional markets fragment across regulated exchanges and dark pools, but benefit from rules like the Order Protection Rule, which enforces price transparency. Crypto markets lack such rules, so price gaps persist. Crypto also adds blockchain fragmentation-same asset (like USDC) on 15+ chains, each with its own DEXs and liquidity pools. This creates isolated markets with no central price authority.
Can retail traders benefit from understanding liquidity fragmentation?
Yes. Retail traders often pay more than they realize because they only see one price. Checking the same asset across two or three exchanges can reveal price differences of 0.5% to 1.5% during volatility. Using aggregation tools or simply comparing quotes can reduce your effective spread. You don’t need advanced tech-you just need awareness.
What tools are used to navigate fragmented markets today?
Institutional traders use smart order routing systems (like LSEG Workspace), liquidity mapping dashboards, and AI-driven prediction models that forecast where liquidity will move. Many build custom API abstraction layers to handle inconsistent exchange data. For crypto, tools like Kaiko’s cross-chain liquidity mapping help track assets across blockchains. Even basic platforms now offer multi-venue price aggregation for retail users.
How did the Terra/Luna collapse expose fragmentation risks?
During the collapse, liquidity vanished unevenly across exchanges. Some platforms froze withdrawals, others saw spreads explode, and DEXs couldn’t match the pace of selling. Because there was no unified price discovery, panic spread faster. Traders who relied on a single venue got trapped. Those using smart order routing could still find liquidity-just at much higher costs. The event proved fragmentation doesn’t just increase cost-it amplifies risk during crises.
Is fragmentation going away in the future?
No. Fragmentation is structural, not temporary. Regulatory efforts like Reg NMS slowed it in equities but didn’t stop it. In crypto, new blockchains and DEXs keep emerging. Blockchain interoperability is making liquidity more distributed, not centralized. The future isn’t about eliminating fragmentation-it’s about learning to navigate it. Tools powered by AI and machine learning are becoming essential, not optional.