
AI ROI Calculator
Estimate Your AI Implementation Value
Calculate potential productivity gains, quality improvements, and time-to-value for your AI project.
Estimated AI Impact
3 Pillars of ValueNote: These calculations use industry benchmarks from the article. Actual results may vary based on your implementation and business context.
Most companies don’t fail at AI because the technology doesn’t work. They fail because they can’t prove it’s worth the investment. You deploy a chatbot, automate reports, or run predictive models - but then what? No one can say if it saved time, reduced errors, or moved the needle on revenue. That’s where measuring AI ROI becomes not just useful - it’s essential.
Why Traditional ROI Falls Short for AI
Traditional ROI calculations look at revenue minus cost. Simple. Clean. But AI doesn’t always make money directly. Sometimes it saves hours. Sometimes it prevents mistakes. Sometimes it lets people focus on higher-value work instead of drowning in paperwork. If you only track dollars, you’ll miss half the story.A 2023 study by Worklytics found that 74% of companies saw no tangible value from their AI projects - not because the tools failed, but because they measured the wrong things. They tracked model accuracy or number of automated tasks, but not how those changes affected real work.
Here’s the problem: if you don’t measure what matters, you can’t improve what works. You end up stuck in pilot purgatory - running small tests that never scale because leadership can’t see the return.
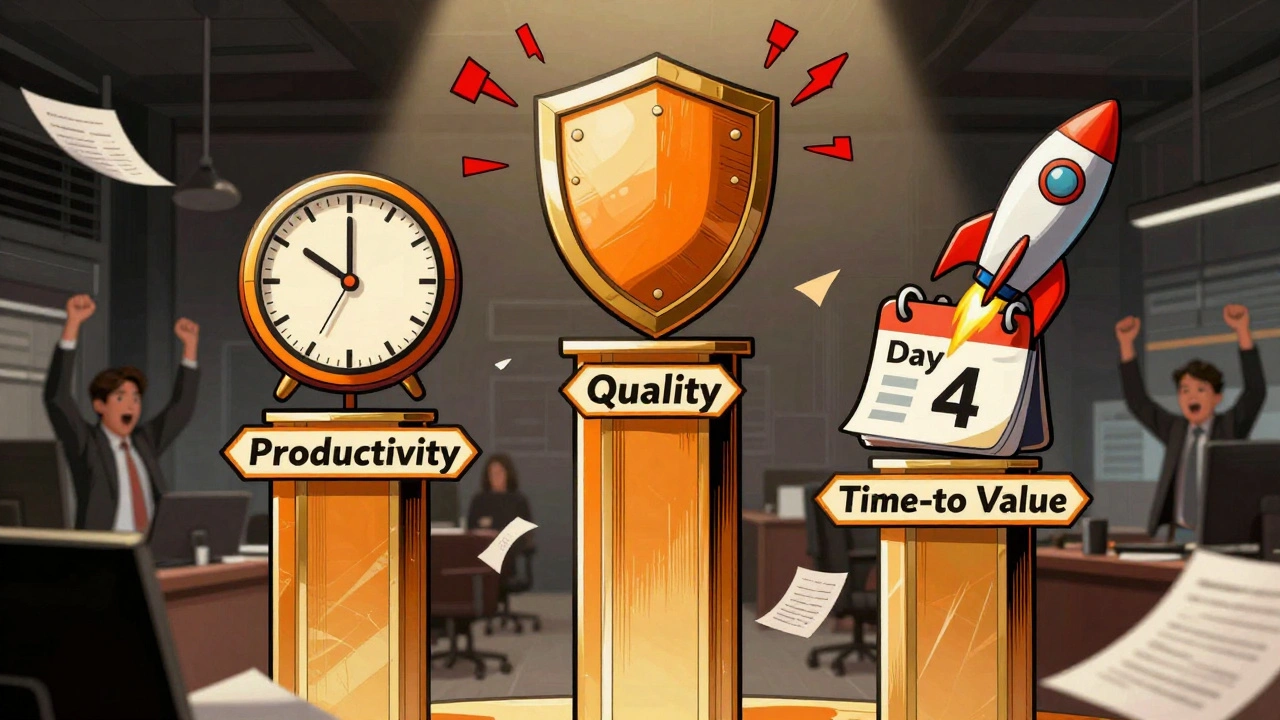
Three Pillars of Real AI ROI
The most effective AI ROI frameworks today rely on three core pillars: productivity gains, quality improvements, and time-to-value. These aren’t buzzwords. They’re measurable outcomes tied directly to business performance.Productivity Metrics answer: How much faster or more efficiently is work getting done? This isn’t about how many prompts users type. It’s about how much time they save. For example, a financial services team reduced invoice processing from 10 hours to 6.5 hours per week using AI-assisted document extraction. That’s a 35% drop in cycle time. Multiply that across 50 employees, and you’re talking 1,750 hours saved annually - roughly 87 full workweeks.
Quality Uplifts measure fewer errors, better decisions, and improved consistency. In healthcare billing, one provider cut claim denials by 30% after deploying an AI system that flagged missing codes before submission. In manufacturing, AI-powered visual inspection reduced defect escapes by 42%. These aren’t abstract improvements - they’re dollars saved in rework, compliance fines, and customer churn.
Time-to-Value Dashboards track how fast AI moves from idea to impact. Too many teams spend months building models that never get used. A dashboard that shows: days from deployment to first user, adoption rate within 30 days, and first measurable outcome (like reduced task time or fewer errors) keeps teams focused. One company reduced their average time-to-value from 11 weeks to 4 weeks by using this approach - and scaled six AI pilots in six months.
Key Metrics That Actually Matter
Forget vanity metrics like ‘number of AI users’ or ‘total prompts generated.’ Real metrics tell you whether AI is changing behavior - not just being used.- Daily Active Users (DAU): % of licensed users who use AI daily. Target: above 60%. If less than half your team uses it regularly, you’re not getting scale.
- Session Depth: Average number of prompts per session. Optimal range: 3-8. One prompt? Probably just curiosity. Eight? That’s workflow integration.
- Feature Utilization: % of available AI features being used. Target: above 40%. If teams only use the chatbot and ignore the forecasting tool, you’ve got adoption gaps.
- Engagement Consistency: % of workdays with AI usage. Target: above 70%. Sporadic use doesn’t drive ROI.
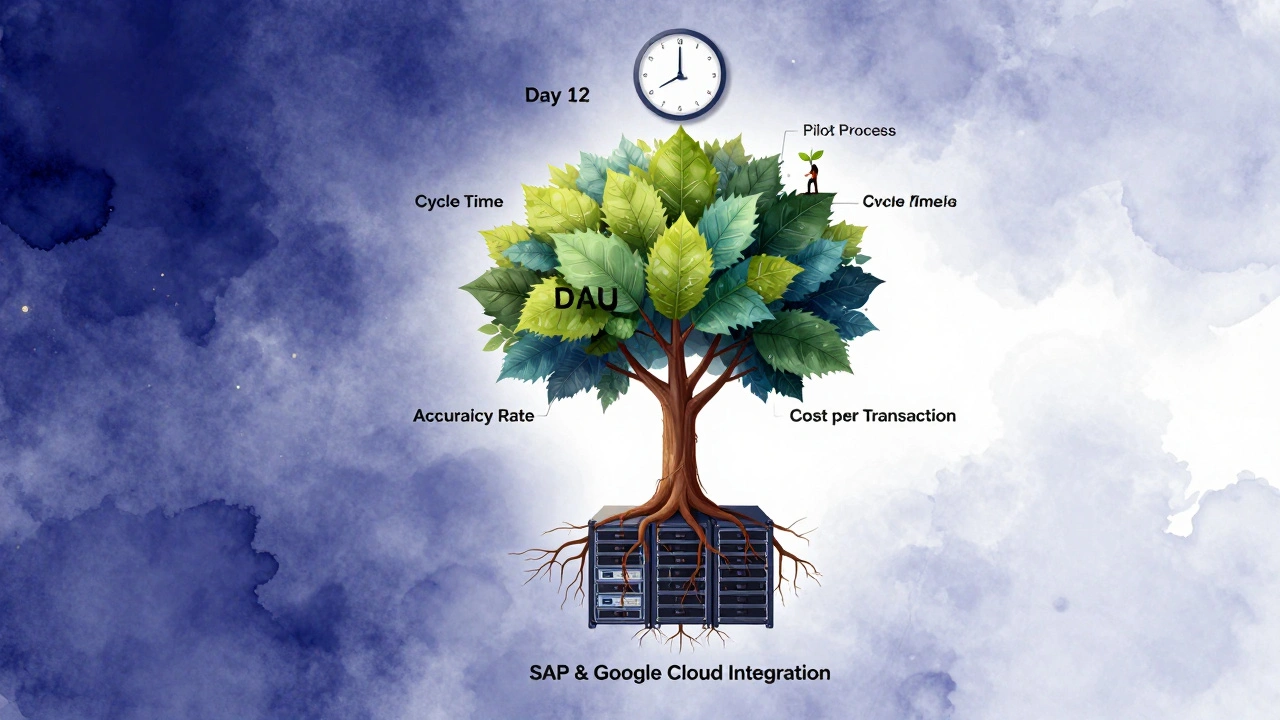
- Cycle Time Reduction: How much faster a task takes now. Documented cases: 30% faster loan approvals, 25% quicker patient intake.
- Accuracy Rate: % of AI outputs that are correct. Benchmarks: 90-95% for demand forecasting, 88% for customer support responses.
- Cost per Transaction: Cost to automate one action. One company cut cost per invoice from $4.20 to $3.36 - a 20% drop.
These numbers don’t exist in a vacuum. They need to be tied to business systems. If your AI tool runs on Google Cloud but your payroll data lives in SAP, you need integration. Otherwise, you’re guessing at the impact.
How to Avoid Inflated ROI Numbers
A Capterra review from December 2024 revealed a common trap: companies saw their ROI numbers jump 22% after launching AI - but it turned out they’d also redesigned their entire workflow. The AI didn’t cause the gain; it rode on top of another change.To isolate AI’s true impact, use control groups. Take two similar teams. Give one AI tools. Keep the other on old methods. Compare their output over 60-90 days. That’s how Worklytics and Kyp.ai recommend measuring true lift.
Another mistake? Ignoring the lag. AI doesn’t pay off overnight. CIO.com’s 2023 analysis found it takes 3-18 months for AI to deliver full value. If you check ROI after 30 days and declare failure, you’ll kill good projects before they mature.
Real Examples: What Works in the Field
On Reddit’s r/AITech, a financial services team shared how they tracked time-to-decision - not cost savings. Before AI, loan approvals took 72 hours on average. After AI-assisted document review and risk scoring, that dropped to 40 hours. That’s a 45% faster decision cycle. Customer satisfaction scores jumped 15 points. That’s ROI you can explain to your CEO.
In manufacturing, a company automated manual documentation using AI that tracked worker actions. They found workers spent 35% less time filling out forms - not because they were lazy, but because the AI captured the data automatically. That freed up time for maintenance checks, reducing equipment downtime by 18%.
A healthcare provider saw 25% faster patient intake after AI pulled insurance info and pre-filled forms. But the real win? Employee satisfaction scores rose 18 points. Nurses said they finally had time to talk to patients instead of typing.
These aren’t hypotheticals. They’re real outcomes from companies that measured the right things.
Building Your Own AI ROI Dashboard
You don’t need a fancy platform to start. Here’s how to build your own:- Start with one process. Pick a task that’s repetitive, time-consuming, and error-prone. Invoice processing. Customer onboarding. Inventory forecasting.
- Baseline it. Measure current time, cost, and error rate. Write it down. Don’t guess.
- Deploy AI. Use a pilot group. Track usage daily.
- Measure weekly. Track DAU, session depth, cycle time, and accuracy. Use a simple spreadsheet if you have to.
- Compare. After 60 days, compare the AI group to the control group. What changed?
- Report in business terms. Don’t say ‘model accuracy improved.’ Say ‘we saved 120 hours per month and cut errors by 28%.’
Companies using live dashboards for these metrics - updated daily - saw 37% more accurate ROI calculations, according to Kyp.ai’s 2024 research. Real-time data beats quarterly reports every time.
The Future: From ROI to Value Velocity
The latest shift isn’t about measuring return - it’s about measuring speed. Berkeley Executive Education’s October 2025 analysis introduced value velocity: how fast AI generates measurable benefit. That’s the new north star.Why? Because AI moves fast. If you wait six months to measure ROI, you’ve already missed your window to pivot. A dashboard that shows: ‘Deployed on Jan 3. First user on Jan 5. 15% faster task completion by Jan 12’ tells you everything you need to know.
By 2027, Forrester predicts 65% of enterprises will use AI-powered analytics to auto-calculate ROI. That means the tools will do the math for you - but only if you feed them the right data.
The AI Measurement Consortium, launched in January 2026, is pushing for standardized metrics across industries. Financial services will track labor hours saved. Healthcare will track error reduction. Manufacturing will track uptime gains. This standardization will make it easier to prove value - and get more funding.
What to Do Now
If you’re still asking, ‘Is AI worth it?’ - you’re asking the wrong question. The real question is: ‘Are we measuring what matters?’Start small. Pick one process. Baseline it. Add AI. Track usage and outcomes. Don’t wait for perfection. Don’t wait for a fancy dashboard. Just start measuring.
The companies winning with AI aren’t the ones with the most advanced models. They’re the ones who know exactly how much value each tool creates - and why.
What’s the biggest mistake companies make when measuring AI ROI?
The biggest mistake is measuring AI in isolation. Many teams track model accuracy or number of automated tasks, but ignore how those changes affect real work - like time saved, errors reduced, or employee satisfaction. Without tying AI to business outcomes, you can’t prove its value. You also risk inflating results by not using control groups to isolate AI’s true impact from other process changes.
How long does it take to see ROI from AI?
It varies, but most organizations see initial results within 30-60 days for productivity gains like faster task completion. Full ROI - including cost savings, quality improvements, and revenue impact - typically takes 3 to 18 months. The key is tracking leading indicators early (like user adoption and cycle time) so you can adjust before waiting for financial results.
Do I need special software to measure AI ROI?
No, but it helps. You can start with spreadsheets and manual tracking - many companies do. But to scale, you need integration between your AI platform and business systems (like ERP, HRIS, or CRM). Platforms like Worklytics, Power BI, or Tableau with custom dashboards make it easier to pull data from multiple sources and visualize trends in real time.
Can AI ROI be measured for individual users?
Yes - and sometimes that’s more powerful. Berkeley Executive Education’s 2025 analysis found that personal productivity AI (like AI writing assistants or task organizers) shows the highest success rates because individuals can experiment, iterate, and measure value in terms of time saved or stress reduced. Tracking personal productivity gains can build momentum for broader organizational adoption.
What’s the difference between productivity metrics and quality uplifts?
Productivity metrics measure speed and efficiency - how much faster or more work gets done. Quality uplifts measure correctness and reliability - how many errors are avoided, how consistent the output is. One might save 20 hours a week (productivity). The other might reduce billing mistakes by 30% (quality). Both matter, but they tell different stories about AI’s value.
How do I get leadership to support AI ROI tracking?
Show them a before-and-after comparison of one real process. Don’t talk about AI. Talk about hours saved, mistakes avoided, or decisions made faster. Use numbers they understand - like ‘we freed up 120 hours per month’ or ‘we cut rework costs by $48,000 a year.’ Leadership cares about outcomes, not tools. Make the connection between AI and business results clear and simple.